
If you have been working in Search Engine Optimization for a while, you know the struggle: you are doing great work, but the client is overwhelmed by spreadsheets.
Looker Studio is the one tool that solves this. It seamlessly integrates with Google Search Console, Google Analytics, and even third-party tools via Google Sheets. It allows us to create beautiful, automated dashboards that visually prove the ROI of our work.
However, a report is only as good as the story it tells. Over the years, I have refined a specific report structure that clients actually understand and appreciate.
Here are the five essential dashboards I recommend including in your monthly Looker Studio report.
Click here to get the Looker Studio Report for SEO Reporting. Just connect your data sources and you are good to go!
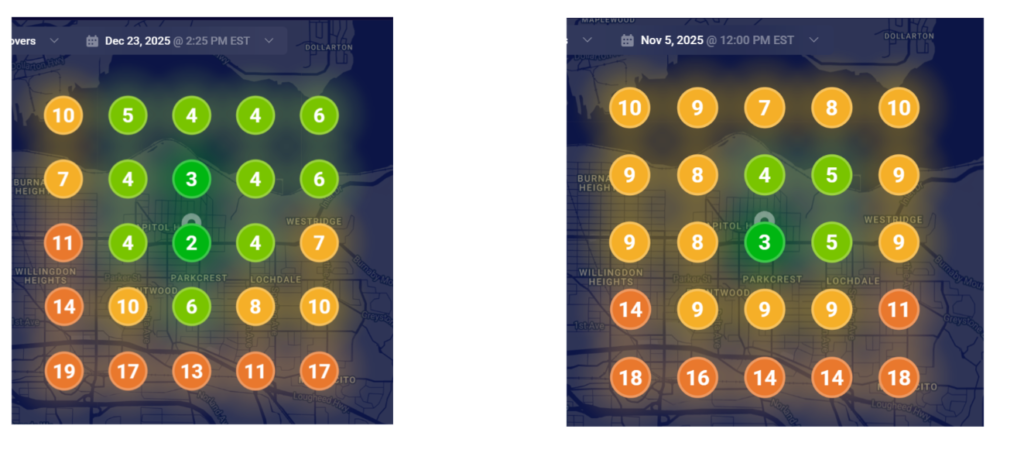
1. Map Grids: The “Before and After” Visual
For local businesses, nothing speaks louder than seeing their territory expand.
I dedicate the first section of my report to Map Grid Ranking Screenshots. Using a local rank tracking tool, I take a snapshot of the grid rankings for the client’s main keywords.
I am using Whitespark local grids, and this tool is also cost-effective.
I usually focus on just one or two primary keywords for this section, and then I paste the “Before” image next to the “After” image.
Showing a grid turning from red (poor rankings) to green (top 3 rankings) is the fastest way to validate your efforts in the first 30 seconds of the report.
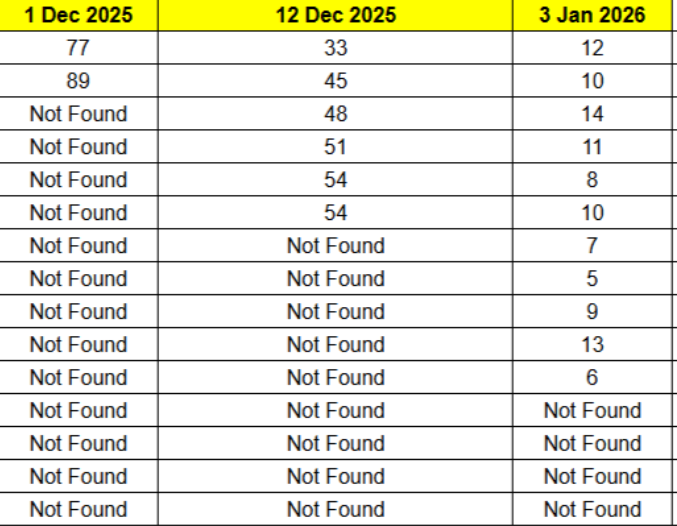
2. Keyword Ranking Snapshots
While Google Search Console provides average positions, clients often want to know exactly where they stand for their specific “money keywords.”
I don’t rely solely on automated tables here. My workflow involves:
- Using an API integrated with Google Sheets (you can use n8n and DataforSEO API and integrate it with Google Sheets) to gather precise rankings for the specific keywords I am tracking.
- Generating a clean list of these rankings.
- Taking a screenshot of that report and embedding it directly into Looker Studio.
This gives the client a static, undeniable view of their progress on the terms that matter most to their bottom line.
3. The Google Search Console (GSC) Report
This is the engine room of the report. Here, we look at the raw health of the website in search results.
I configure this dashboard to display Total Clicks and Total Impressions, specifically comparing them with the previous month.
The Graph: I add a time-series chart showing Clicks and Impressions over the last 30 days. By the grace of God, because of consistent effort, this graph usually shows an upward trend, which builds massive trust.
The Breakdown: I include two tables:
Top Keywords: Showing exactly which queries are driving clicks and impressions.
Top Pages: Showing which URLs are performing best.
4. Google Analytics: The Organic Growth Filter
Traffic numbers mean nothing if we don’t know where they came from. In Looker Studio, I create a strict filter to show only “Organic Traffic.”
I compare this data with the previous month to showcase growth. But I also go deeper depending on the client’s scope:
- For International Clients: I add a “Country-wise” traffic breakdown to show global reach.
- For Local Businesses: I drill down to “City-wise” traffic. If a plumber in Brampton is getting traffic from Vancouver, it doesn’t help them. I use this section to prove we are driving relevant local visitors.
5. Future Recommendations & Strategy
Never end a report with just data; end with a plan. This is where you transition from a “service provider” to a “strategic partner.”
In this final section, I share:
- What are we planning to do next month?
- What is the future strategy?
- Strategic Recommendations: This is the perfect place to propose necessary investments, such as an increase in the link-building budget or a technical audit, backed by the data shown in the previous slides.
Conclusion
Clients don’t fire agencies because of bad results; they fire them because of bad communication. By using this 5-part Looker Studio structure, you aren’t just reporting numbers—you are showing visual proof of ranking improvements, verifying traffic quality, and setting the stage for future growth.